
LEVEE by Perennial
Some knowledge between you and known flood risk.
A free flood map for NSW property owners and industry professionals. LEVEE brings the flood studies your council has already published into one map and explains them in plain terms: how far a flood reaches, how deep it gets, and which planning rules follow.
The objective is straightforward. Make flood risk planning accessible, digestible and better understood in NSW.

Expression of interest for professionals
LEVEE is open for consultation with suitably qualified professionals while accounts are provisioned: flood and water engineers, councils, government agencies, and the insurance and finance sector. You would get the practitioner view of the map, and the ability to contribute to it.
What LEVEE asks of councils and of consultants, and what it never asks for, is set out on the contribution page. The short version: no model files, no reports.
Perennial is calling on all flood experts and risk policy makers to join a collective effort to improve the state of the market.
Tell us who you are and what you work on, and we will be in touch about access.
What LEVEE stands for
Five things a flood study can tell you about a place. They are the five headings on the map, in this order, and they spell the name.
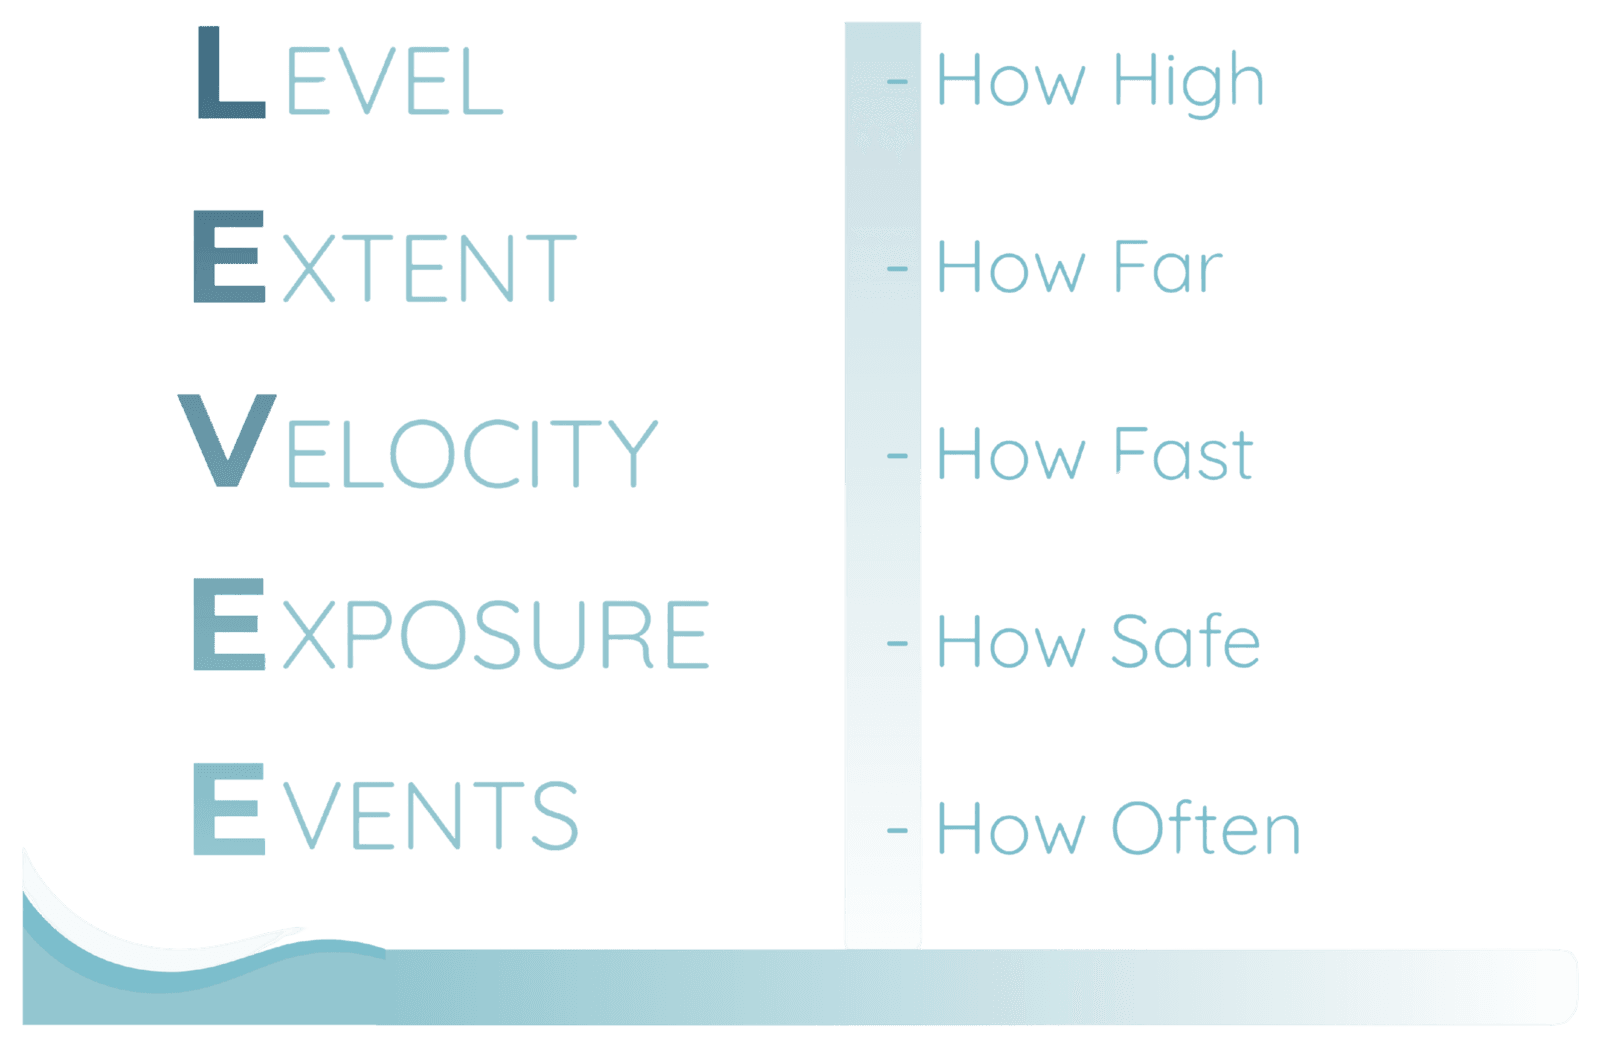
- Level
- How high
- Extent
- How far
- Velocity
- How fast
- Exposure
- How safe
- Events
- How often
How high, how far, how fast, how safe and how often, in one place and at no cost.
4x components of flood risk planning in one location
Anyone considering a property purchase or development site should be able to easily see what flood information exists, who produced it, and how current it is, without digging for PDFs across a dozen council websites.
LEVEE Learn
Interactive tools explaining how flooding works.
For all levels.
- Flood planning levels
- Terminology against real, digestible probability
- The bathtub effect and flood storage
Start learning
LEVEE Map
A simple map of the known flood risk at your property.
For owners, buyers, planners and non-experts.
- Plain terminology
- Fewer layers, showing the key maps, severity and next steps
- Live for six council areas plus the Hawkesbury-Nepean valley, growing study by study
Open the map
LEVEE Connect
A directory of consultants actively working in your area.
For owners, buyers, planners and non-experts.
- Visual and spatial, on the same map
- Approved consultant work: modifying a council model, or new
Open Connect
LEVEE Pro
A detailed map of adopted flood study data and the model parameters behind it.
For engineers and experts.
- Input parameters and assumptions for each study
- Results for all events: levels, depths, velocities, hazard
Open the Pro demo
FreeBoard
A per-lot summary of the flood planning controls that apply to your property, drawn from the mapping in plain terms.
Included with Map: click any lot
Links to apply for flood information certificates and to relevant council websites and DCP controls are built in, improving the ability to obtain information without an expert consultant.
Every element is free. Built on published government data under open licences, and independent of council participation.
Flood risk is a game of statistics
Translating terminology into plain English
The industry describes floods by their chance of happening in any one year. That is accurate and widely misread, so the map pairs each probability with a plain name and with the chance that matters to a person: whether they will see that flood across a lifetime.
| Name | Chance in any year | Chance of occurring in the average 80-year lifetime | What it means |
|---|---|---|---|
| Frequent | 20% chance in any year | More than 99% | A flood most people will see more than once. The 20% AEP event. |
| Uncommon | 5% chance in any year | About 98% | A serious flood that is still likely within a lifetime. The 5% AEP event. |
| Benchmark | 1% chance in any year | About 55% | The 1% AEP event, which NSW flood planning is built on. Drawn on the map as the Benchmark Flood. |
| Rare | 0.2% chance in any year | About 15% | Beyond the planning benchmark, but still a real possibility. The 0.2% AEP event. |
| Maximum | Not given an annual chance | Not quantified | The largest flood that could conceivably occur. Drawn on the map as the Maximum Floodplain. |
Flood events do not take turns. A 1% chance in one year does not reduce the chance the following year, which is why the old habit of describing the planning benchmark as a once-a-century event is retired. The lifetime column is calculated from the annual chance compounded across an average 80 year lifespan.
To explore the statistics further, see LEVEE Learn.
Consistent and clear communication, one colour language used statewide
LEVEE draws every council area in one ramp: one hue, darker for floods that happen more often, validated for colour vision deficiency. How that compares with current practice is shown on the research page.
LEVEE, statewide
Frequent
Uncommon
Benchmark
Rare
Maximum
LEVEE Learn
Short, interactive explainers on how floods behave. See how high and how far a flood reaches, how likely it is over the time you own a place, and why the planning rules exist.
Teaching councils
Grown from staff education sessions for council development engineers, teaching planners the fundamentals of flood risk.
Teaching professionals
Presented to planning consultancies and industry committees, whose flood planning committees informed the platform's direction.
Teaching the public
Interactive tools translating flood levels, event probability and planning terms into plain language, with the same material that trained the professionals.
Know when your area is added
LEVEE Map is live for Newcastle, Wollongong, Hawkesbury, Sutherland Shire, Wollondilly and Penrith, and the Hawkesbury-Nepean valley study covers the floodplain upstream and downstream of those areas as well. We map catchment by catchment, so an area being absent from the map does not mean it does not flood. Leave your email and we will let you know when your area is covered.
Get notified when a new study is published or a draft goes on public exhibition in your area. No such service currently exists in NSW.
See it through. Open the map